

Most agencies report Local Service Ads the same way: cost per lead. It is easy to pull, and it is the wrong number to run a law firm on.
A lead is a phone call. A signed case is revenue. As a specialist law firm LSA agency, we followed $1,202,095 in Local Service Ads spend across 9 plaintiff-side firms through 2025, down to the 476 signed cases it produced.
Key Findings
- A signed case from LSA cost $2,525 on average. That is the tracked figure. The full report shows where it lands once you correct for the cases these firms could not attribute.
- The cheapest leads produced the most expensive cases. Immigration leads cost $72, the lowest in the study, and converted at 2%. Each signed case cost $4,188.
- Tracking gaps hid roughly 27% of signed cases. These firms could attribute 476. The real number is higher, and the report carries it practice area by practice area.
What A Signed Case Costs, By Practice Area
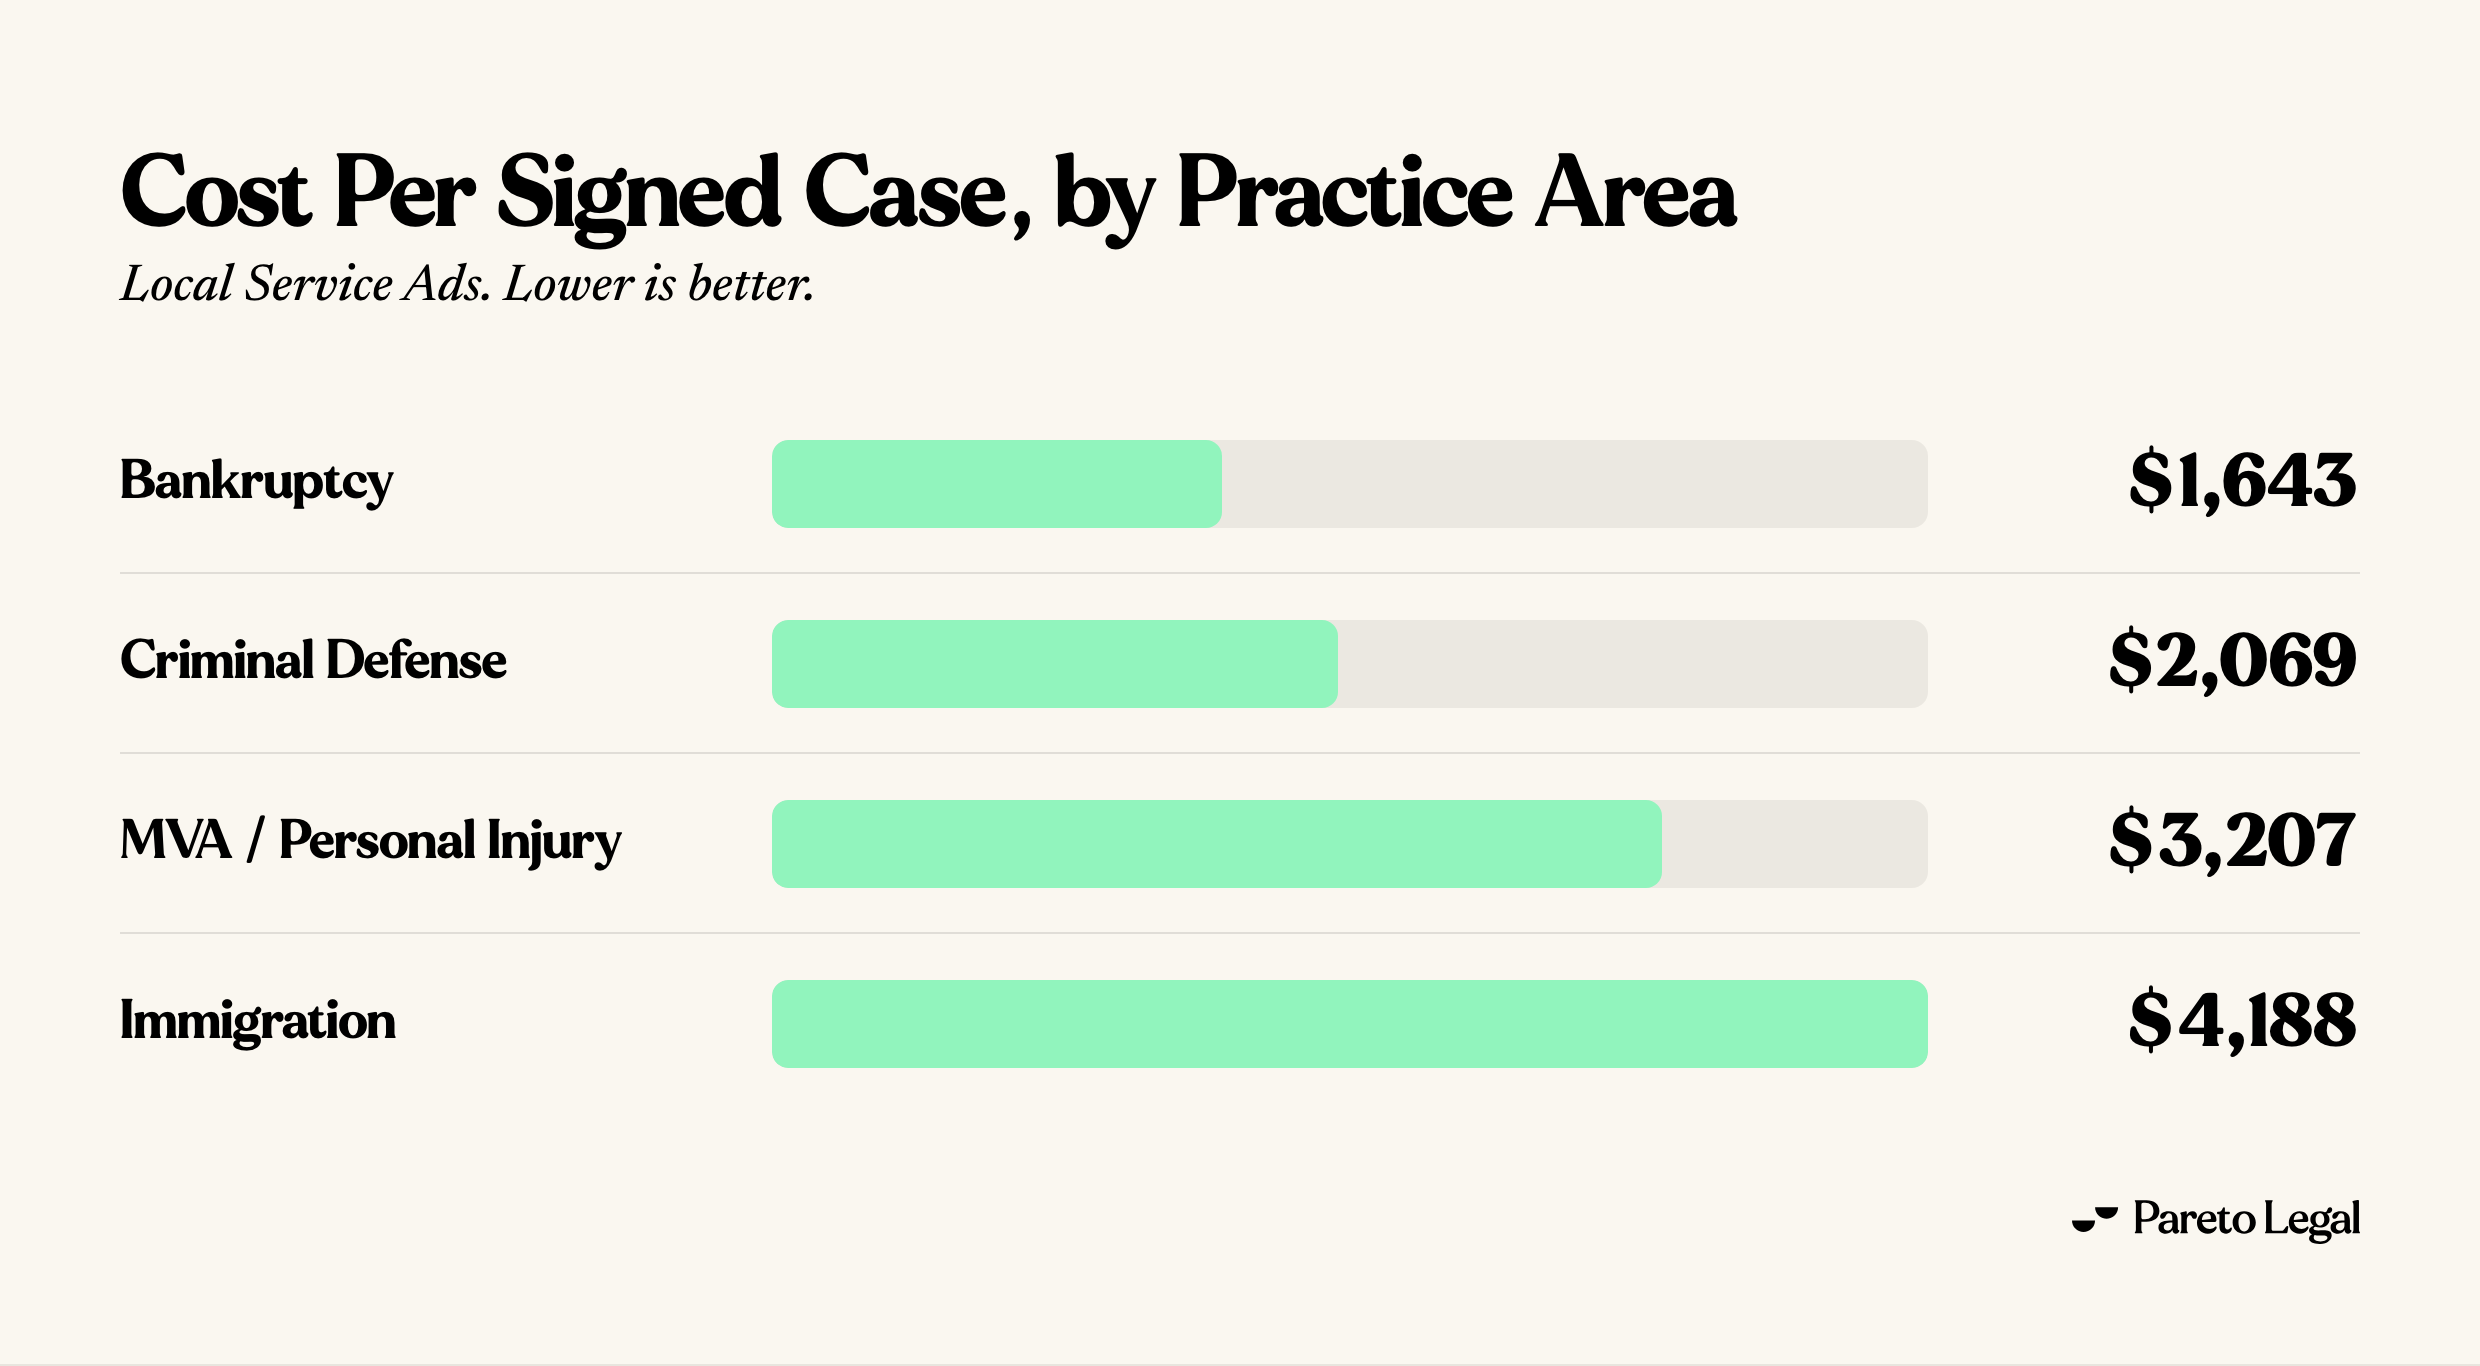
Tracked cost per signed case ran from $1,643 in bankruptcy to $4,188 in immigration. Bankruptcy and immigration are single-client samples, so read them as direction, not gospel.
| Practice Area | Clients | Cost Per Lead | Lead→Case | Cost Per Signed Case |
|---|---|---|---|---|
| MVA / Personal Injury | 5 | $315 | 10% | $3,207 |
| Criminal Defense | 2 | $186 | 9% | $2,069 |
| Bankruptcy | 1 | $159 | 10% | $1,643 |
| Immigration | 1 | $72 | 2% | $4,188 |
Why The Cheapest Practice Area Cost The Most Per Case
Immigration bought the cheapest leads in the study and signed the priciest cases. Immigration leads cost $72, less than a quarter of MVA-PI’s $315. But only 2% became signed cases, so each case cost $4,188, the highest in the study.
One client and three cases is a small sample. The lesson still holds everywhere we look: cheap leads are not valuable, signed cases are.
Bankruptcy delivered the lowest cost per signed case. The study’s one bankruptcy client signed 71 cases at $1,643 each, converting 10% of leads.
MVA personal injury is the volume engine. Five of the nine clients are MVA-PI firms. They account for 57% of study spend and 212 signed cases at $3,207 each, and 98% of their LSA calls connected, the study’s highest rate.
LSA vs Google Ads: Lower Cost Per Signed Case
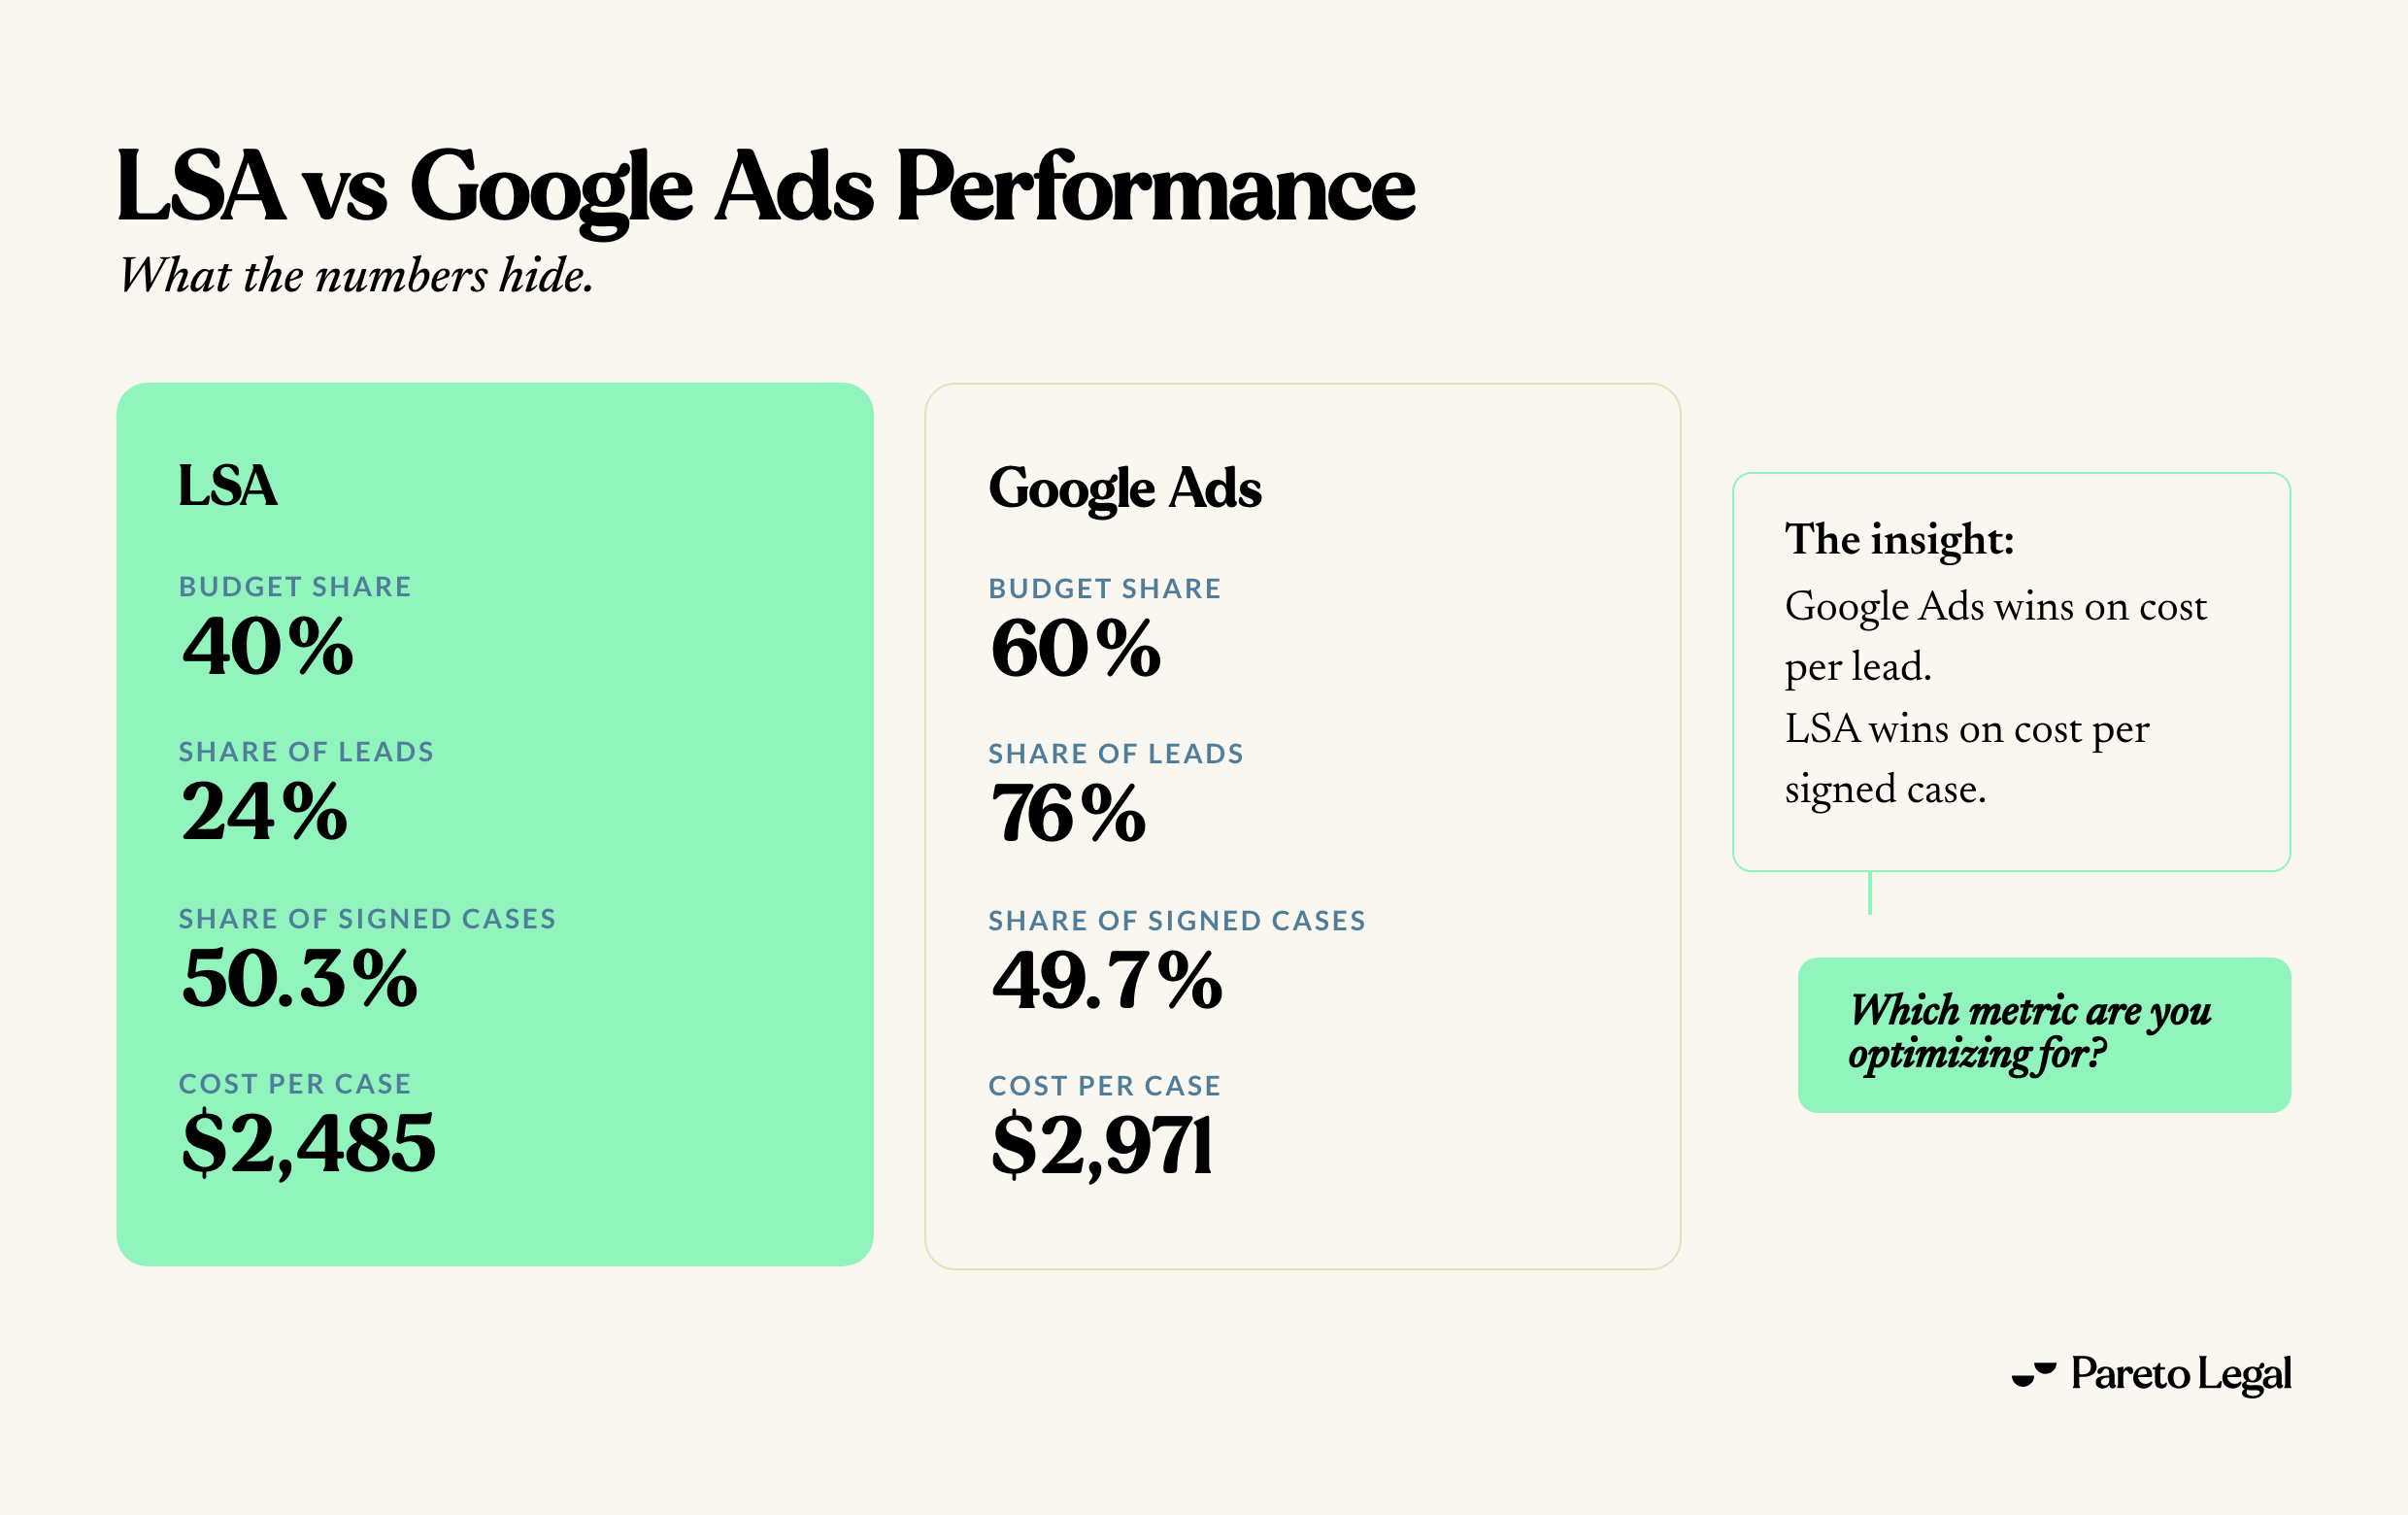
LSA took 40% of the combined budget and produced 50.3% of signed cases, at a lower cost per case than Google Ads.
| Channel | Share of Budget | Share of Leads | Share of Signed Cases | Avg CPL | Avg Cost Per Case |
|---|---|---|---|---|---|
| Local Service Ads | 40% | 24% | 50.3% | $205 | $2,485 |
| Google Ads | 60% | 76% | 49.7% | $95 | $2,971 |
LSA looks expensive per lead, more than double Google Ads, and it produced only 24% of the leads against Google Ads’ 76%. It still delivered half the signed cases on 40% of the budget.
Comparing cost per lead across the two platforms is misleading on its own. Google Ads counts forms and chats, while LSA lead volume is predominantly phone calls. The same pattern turned up in our 13-firm study of law firm PPC statistics, which is where these channel figures come from.
Also Read:Local Service Ads For Law Firms →The 27% Signed-Case Tracking Gap
These nine firms could attribute 476 signed cases to LSA, and roughly 27% more existed that they could not prove.
We track each client’s match rate, meaning how completely their leads tie back to case outcomes. Where the match rate is low, real signed cases sit in the account unattributed, and every cost per case you calculate reads worse than the truth.
Immigration was the extreme case. Its tracked $4,188 per signed case is not what that channel actually cost the firm. The report carries the corrected figure for all four practice areas, along with the match rates behind each one.
Reviews Decide How Often Your Firm Gets Served
LSA rankings are heavily tied to review quantity, velocity, and recency. In this study the clearest signal was volume: firms with 500 or more reviews averaged 349 leads a month, nearly three times any other review tier. That tier is three clients, so read direction, not decimals.
Cost per lead did not move in a straight line with review count, and cost per signed case moved even less. The report breaks all five review tiers out so you can see where your own profile sits.
Get The Full Report
Download the State of Law Firm LSA 2026 report, which breaks down:
- The complete funnel from spend to signed case: conversions, leads, connected leads, and the real unit cost of a charged call
- The corrected cost per signed case for every practice area, and the match rates that produce it
- How many signed cases the study projects at clean tracking, against the 476 these firms could attribute
- All five review tiers, with leads per month, cost per lead, and cost per signed case
- The intake failures that quietly drain LSA budgets, including one firm that cut a large share of its LSA spend with no loss in signed cases
- The answer-rate floor we hold clients to, the job-type setting behind most junk-lead complaints, and the audit checklist we run on every LSA account
Get the full report by sharing your name and email below.
By submitting, you agree to our privacy policy.
About This Study
The State of Law Firm LSA 2026 report analyzes Local Service Ads performance across nine plaintiff-side law firms managed by Pareto Legal. All spend and outcome data come from Pareto-managed accounts.
Methodology
- Clients: 9 plaintiff-side law firms running LSA. 4 worked with Pareto for all of 2025, the rest an average of 5 working months.
- Total LSA spend: $1,202,095, January 1 to December 31, 2025, or respective active working periods.
- Conversions: engine conversions. Lead: total phone calls received. Connected lead: charged phone calls.
- Extrapolated metrics: project signed cases and cost per signed case at a perfect 100% match rate, assuming zero missing sources.
- Exclusions: one MVA-PI client was excluded for lack of accurate reporting infrastructure.